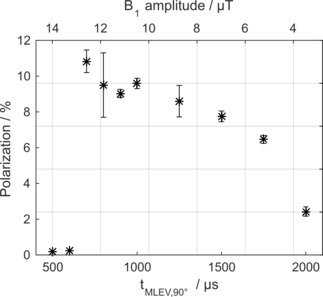
Figure 5.

13C polarization of SUC by T‐GM (Figure 1a) as a function of on‐resonant decoupling pulses. A maximum polarization was observed for t MLEV,90°=700 μs. For shorter pulses, much lower signal was observed. For each t MLEV,90°>600 μs, three experiments were performed, for each tMLEV,90°≤600 μs, one. On the upper horizontal axis, the amplitude of the excitation field is given. Mean and standard deviation of the polarization are shown. Experimental details: setup 2, E4.
