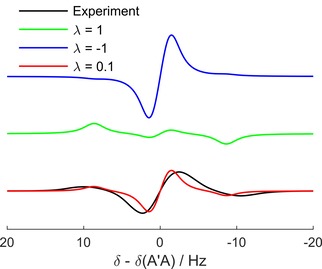
Figure 9.

Experimental and theoretical 1H PASADENA spectra (E7). The features of the experimental spectrum (black line) were reproduced by simulations (red line) when the S‐T0 mixing factor λ was set to ∼0.1. Hence, the experimental spectrum is a superposition of time‐averaged singlet (green line, λ=1) and triplet state (blue line, λ=−1).
