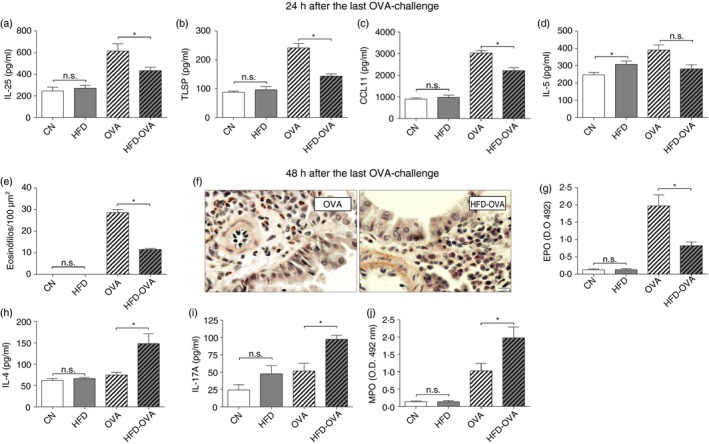
Figure 2.

Experiment validation, obesity promotes greater neutrophil activity and early reduced Th2/eosinophilic response. Levels of the epithelial cytokines interleukin‐25 (IL‐25) (a) and thymic stromal lymphopoietin (TSLP) (b), 24 hr after the last OVA‐challenge. Eosinophil peroxidase (EPO) activity (c), and eosinophil counting on Sirius Red stain in peribronchovascular area (d and e), 48 hr after the last challenge. CCL11 (f) and IL‐5 (g) levels 24 hr after the last challenge. IL‐4, IL‐17A levels and myeloperoxidase (MPO) activity (h), 48 hr after the last challenge. Cytokine and chemokine levels were determined by ELISA and activity assay were used to determine EPO and MPO abundance, in lung homogenates. Values are expressed as mean ± SEM. Different means are indicated as *, for P < 0·05. n = 6 for each group.
