Figure 5.

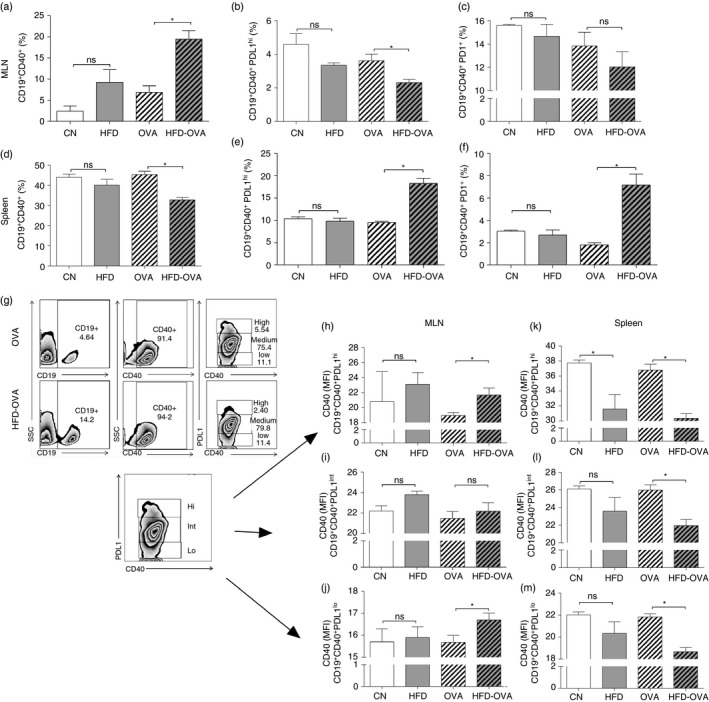
Obesity impacts B‐cell populations in both mediastinal lymph nodes (MLNs) and spleen. CD19+ CD40+ frequency (a, d), CD19+ CD40+ PDL1high frequency in CD19+ CD40+ (b, e), CD19+ CD40+ PD1+ frequency in CD19+ CD40+ (c, f), in both MLNs and spleen, determined by immunophenotyping and flow cytometry. Gating strategy for B cells and their discrimination by PDL1 expression levels, representative image from the MLNs (g). CD40 MFI in CD19+ CD40+ PDL1high (h,k), CD19+ CD40+ PDL1Int (i,l) and CD19+ CD40+ PDL1low (j,m), in both MLNs and spleen, determined by immunophenotyping and flow cytometry 48 hr after the last challenge. Values are expressed as mean ± SEM. Different means are indicated as *, for P < 0·05. n = 6 for each group.
