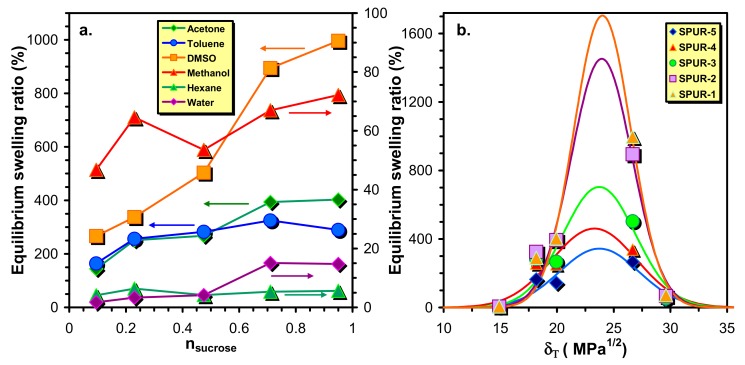
Figure 4.
Variations of the swelling ratios with the molar ratios of sucrose (a) and the dependences of the swelling ratios on the values of the Hildebrand solubility parameter (δT) (b). The solid lines in Figure 4b represent the fitted curves by Equation (8).

