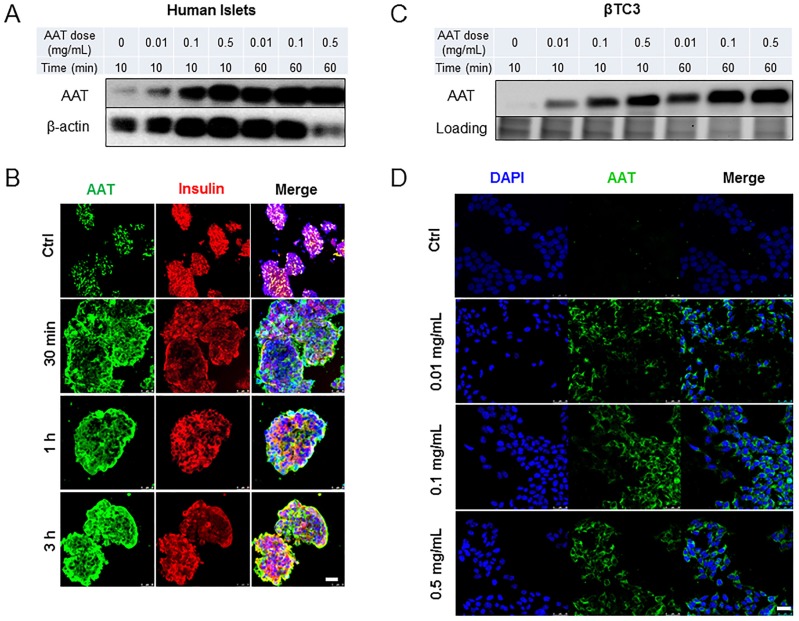
Fig 1.
Time course and dose response of AAT uptake by β cells. (A) Western blot on human islets cultured in the presence of AAT at indicated concentrations for indicated time periods. (B) Representative fluorescent micrographs show human islets stained for AAT (green), insulin (red) and nuclei (blue). Scale bar = 25 µm. (C) Western blot on βTC3 cells cultured in the presence of AAT at indicated concentrations for indicated time periods. (D) Representative fluorescent micrographs show human islets stained for AAT (green) and nuclei (blue). Scale bar = 25 µm. These experiments were repeated three times.

