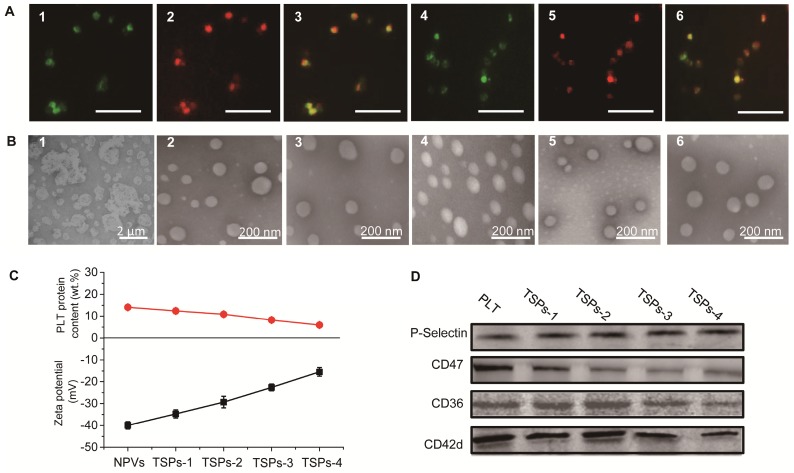
Figure 1.
(A) Fluorescence microscopy images of a DiR iodide-stained PM incorporated with fluorescent lipids: 1) TopFluor® PC signal of a TopFluor® PC-incorporated PM, 2) DiR iodide signal of a TopFluor® PC-incorporated PM, 3) merged image of 1) and 2), 4) TopFluor® Lyso PC signal of a TopFluor® Lyso PC-incorporated PM, 5) DiR iodide signal of a TopFluor® Lyso PC-incorporated PM, and 6) merged image of 4) and 5). The scale bar represents 5 μm. (B) TEM images of 1) PM, 2) NPVs, 3) TSPs-1, 4) TSPs-2, 5) TSPs-3 and 6) TSPs-4. (C) PLT protein content and zeta potentials of NPVs and different TSPs. (D) Identification of PLT and different TSPs for CD36, CD42d, CD47 and P-selectin biomarkers by western blot analysis.

