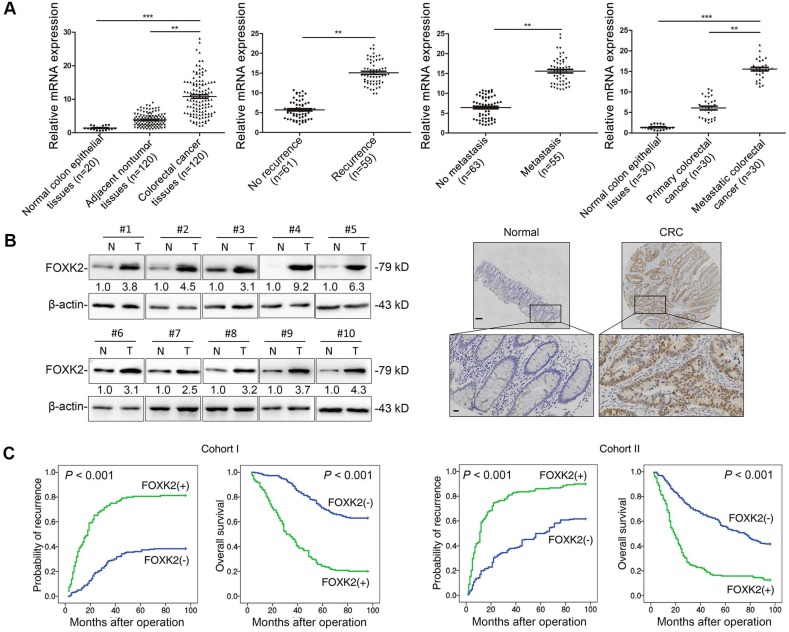
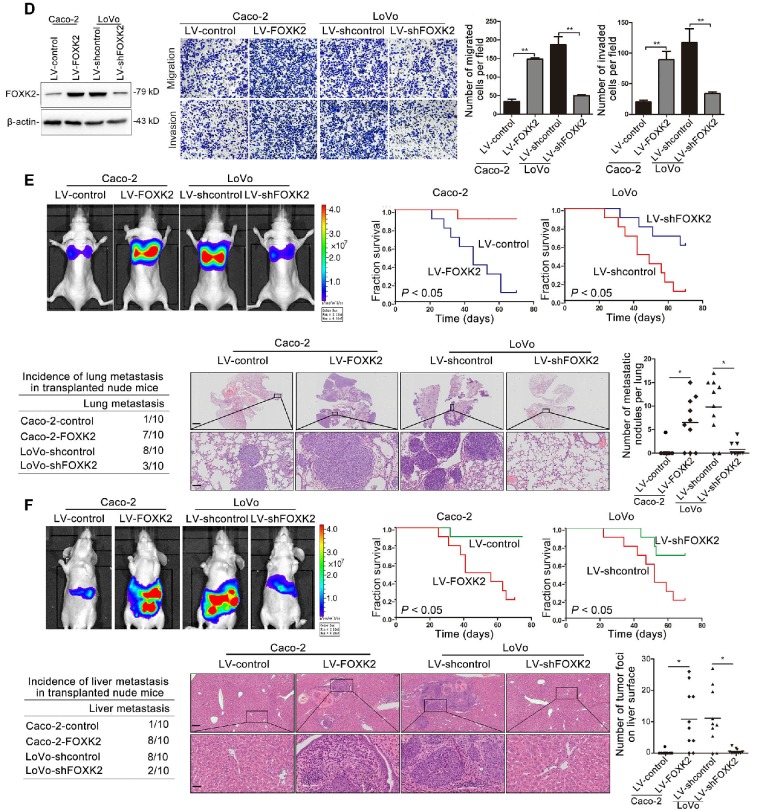
Figure 1.
Elevated FOXK2 expression promotes CRC migration, invasion and metastasis and indicates a poor prognosis in human CRC. (A) RT-qPCR analysis of FOXK2 mRNA expression in 120 pairs of CRC tissues and adjacent nontumor tissues and in 20 normal colorectal epithelial tissues. Relative FOXK2 mRNA expression in patients with (n = 59) or without (n = 61) CRC recurrence. Relative FOXK2 mRNA expression in patients with (n = 55) or without (n = 63) CRC metastasis. RT-qPCR analysis of FOXK2 mRNA levels in normal colorectal epithelial tissues, primary colon cancer tissues and paired metastatic CRC tissues (n = 30). ** P < 0.01; *** P < 0.001 compared with the control. The data are presented as the mean±s.d. (B) Analysis of FOXK2 protein levels in CRC and paired adjacent nontumor tissues (n = 10) by Western blotting and IHC staining. Scale bars: top, 100 μm; bottom, 20 μm. (C) A Kaplan-Meier analysis of the correlation of FOXK2 expression with recurrence and overall survival in cohort I and cohort II. + High; - Low. (D) Western blotting analysis of FOXK2 protein levels in the indicated CRC cells. Transwell assay analysis of cell migration and invasion. n = 3 independent experiments performed in triplicate. ** P < 0.01 compared with the control. The data are presented as the mean±s.d. (E) In vivo lung metastatic assays. Cells were injected into the tail veins of mice (n = 10 mice per group). Bioluminescence imaging 9 weeks after implantation, the incidence of lung metastasis, overall survival times, the number of metastatic lung nodules, and H&E staining of lung tissues from the different groups are shown. Scale bars: top, 500 μm; bottom, 40 μm. * P < 0.05 compared with the control. The data are presented as the mean±s.d. (F) In vivo liver metastasis assays. Cells were injected into the spleens of mice (n = 10 mice per group). Bioluminescence imaging 9 weeks after implantation, the incidence of liver metastasis, overall survival times, the number of metastatic liver nodules, and H&E staining of liver tissues from the different groups are shown. Scale bars: top, 200 μm; bottom, 40 μm. * P < 0.05 compared with the control. The data are presented as the mean±s.d.


