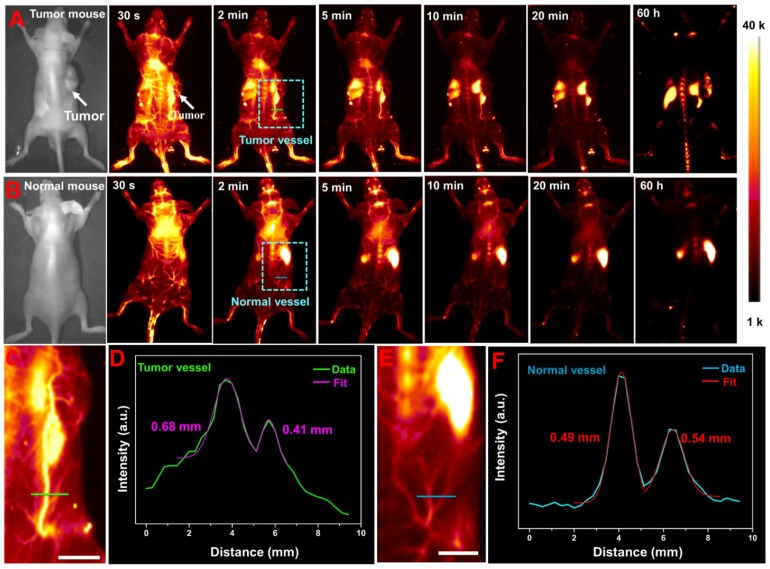
Figure 2.
NIR-II imaging guided tumor vessel tracking and whole-body vessel imaging: (A) LLC tumor-bearing mouse. (B) Normal mouse. (C) and (E) The corresponding zoom-in images of the chosen vessels taken from the rectangle in (A) and (B), respectively. (D) Cross-sectional NIR-II intensity profiles along a green line in tumor-bearing mouse. (F) Cross-sectional NIR-II intensity profiles along a blue line in normal mouse. All scale bars are 10 mm.

