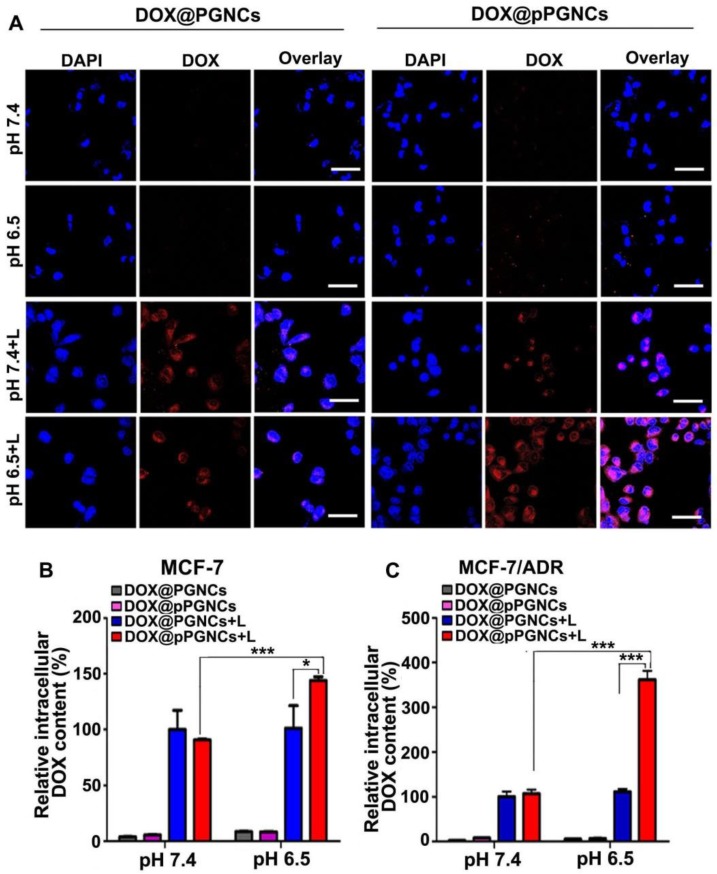
Figure 6.
NIR laser-triggered intracellular DOX release from DOX@pPGNCs. (A) Confocal microscopic images of MCF-7/ADR cells after treatment with DOX@PGNCs or DOX@pPGNCs at DOX concentration of 2 µg/mL for 4 h at pH 7.4 or 6.5, respectively, followed with or without 808 nm NIR laser irradiation (0.7 W/cm2) for 5 min. Scale bar: 50 µm. (B, C) Intracellular DOX content in MCF-7 (B) and MCF-7/ADR cells (C) after treatment with DOX@PGNCs or DOX@pPGNCs at DOX concentration of 2 µg/mL for 4 h at pH 7.4 or 6.5, respectively, followed with or without 808 nm NIR laser irradiation (0.7 W/cm2) for 5 min by flow cytometry. The data are presented as the mean ± SD (n = 3). *P<0.05, ***P<0.001.

