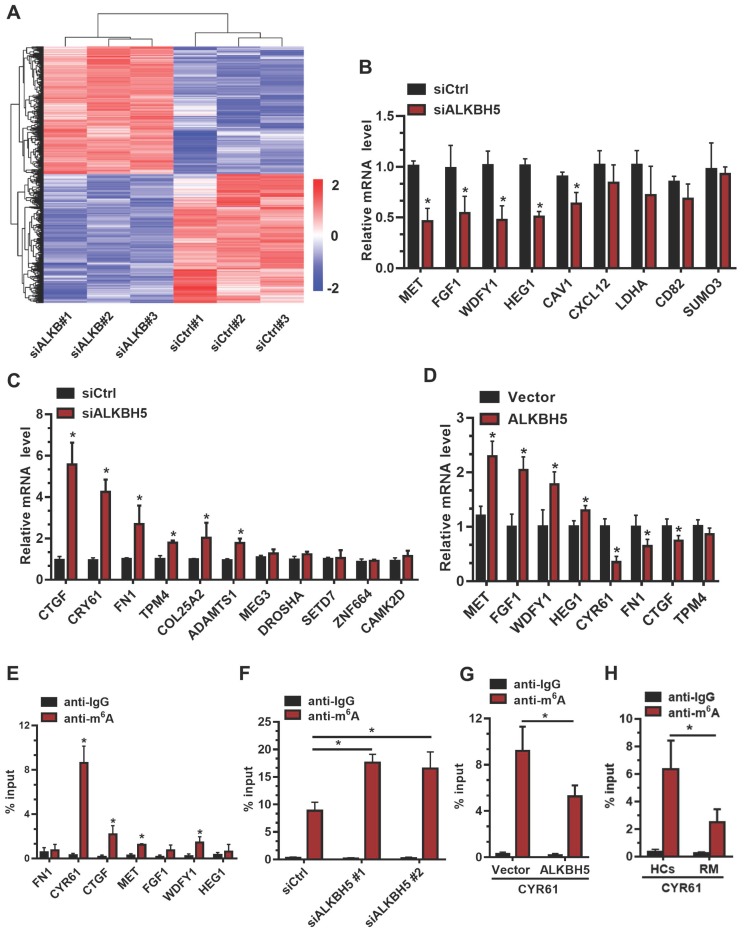
Figure 3.
CYR61 is a downstream target of m6A in trophoblast. (A) Heatmap of normalized gene expression levels of HTR-8 cells transfected with siCtrl or siALKBH5. Blue indicates down-regulation of genes expression; Red indicates up-regulation of genes expression. (B and C) QRT-PCR was performed to determine the mRNA levels of the selected genes in HTR-8 cells transfected with siCtrl or siALKBH5. (D) QRT-PCR was performed to determine the mRNA levels of selected genes in HTR-8 cells transfected with vector or ALKBH5-expressing plasmid. (E) Enrichment of m6A-modified CYR61, CTGF, MET and WDFY1 in HTR-8 cells. The percentage of the input is shown. *P < 0.05 versus anti-IgG. (F) Changes in m6A-modified CYR61 level upon ALKBH5 knockdown. The percentage of the input is shown. *P < 0.05 versus siCtrl. (G) Changes in m6A-modified CYR61 level upon ALKBH5 overexpression. The percentage of the input is shown. *P < 0.05 versus vector. (H) Changes in m6A-modified CYR61 level upon HCs and RM. The percentage of the input is shown. *P < 0.05 versus HCs.

