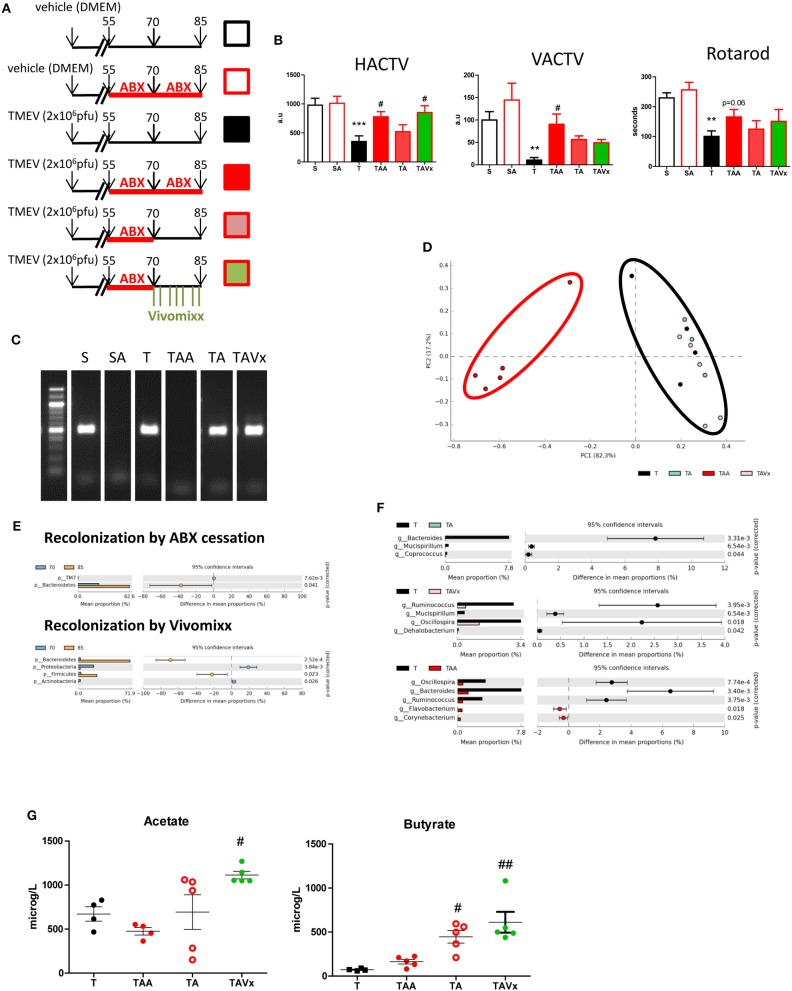
Figure 2.
Partial recolonization after cessation of ABX aggravates motor disability in TMEV-IDD. (A) Scheme of the experimental groups: (S) black open squares, sham mice orally administered autoclaved water; (SA) red open square, Sham mice subjected to ABX treatment from day 55 to 85 pi; (T) black square, TMEV mice administered autoclaved water; (TAA) red square, TMEV mice administered ABX from day 55 to 85 pi; (TA) pink square, TMEV mice administered ABX from day 55 to 70 pi followed by autoclaved water; (TAVx) green square, TMEV mice administered ABX from day 55 to 70 pi followed by oral Vivomixx administration from 70 to 85 dpi. (B) Horizontal (HACTV) and vertical activity (VACTV) was evaluated for 10 min in the Activity cage, while motor coordination was measured for 5 min on the Rotarod apparatus. The data are presented as the means ± SEM: **p < 0.01 vs. S; ***p < 0.001 vs. S; #p < 0.05 vs. T. (C) Agarose gel (1.5%) to visualize the amplicon amplified by 16S (V3–V4) PCR. (D) Principal components analysis of the faecal microbiota from the T (black; n = 4); TAA (red; n = 5); TA (blue; n = 3); TAVx (pink; n = 5) experimental groups. (E) Extended error bar plot identifying significant differences between the mean proportions of bacterial taxa upon recolonization following termination of the ABX treatment or recolonization upon Vivomixx administration. (F) Extended error bar plot to visualize significant differences in the bacterial taxa between the T and TAA group, or the TA or TAVx experimental groups. (G) Quantification of the plasma levels of acetate and butyrate. The data are presented as the means ± SEM: #p < 0.05 vs. T; ##p < 0.01 vs. T.

