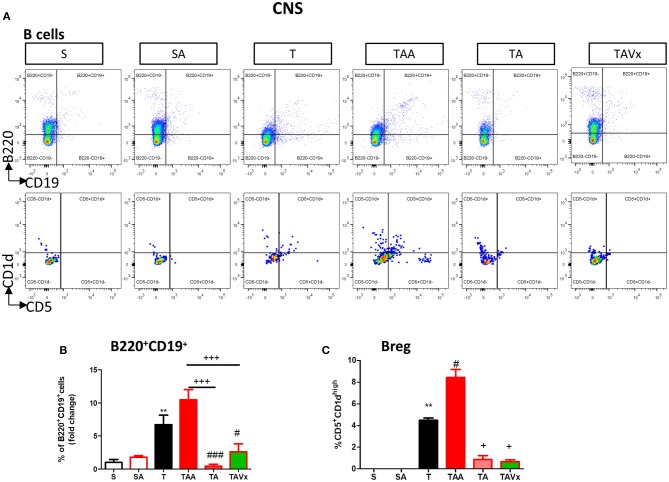
Figure 4.
Changes in B cells in the CNS associated with both dysbiosis and recolonization of the gut microbiota. A single cell leukocyte suspension was obtained from the brain and spinal cord. (A) Representative flow cytometry plots of B220+CD19+ B cells and CD5+CD1d cells, gated on B220+CD19+ B cells. (B) Quantification of the change in the percentage of B220+CD19+ B cells relative to the S mice. (C) Percentage of CD5+CD1dhigh cells in the CNS gated on B220+CD19+ B cells. Groups S, T and TAA (n = 10), and groups SA, TA, TAVx (n = 5). Statistics: **p < 0.01 vs. S; #p < 0.05 vs. T; ###p < 0.001 vs. T; +p < 0.05 vs. TAA; +++p < 0.001 vs. TAA.

