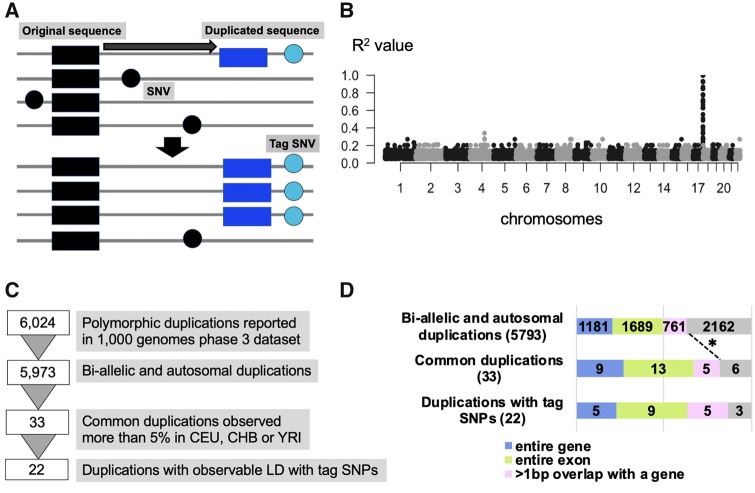
Fig. 1.
—The strategy of the linkage disequilibrium-based method to detect the insertion region of the polymorphic duplication. (A) The schematic representation of our approach to detect insertion sites and haplotypes harboring polymorphic duplications. (B) One example of the linkage disequilibrium-peak between and duplication and SNVs. Each dot indicates a SNV. The X-axis shows chromosomal locations and Y-axis shows the linkage disequilibrium between each SNV and a specific polymorphic duplication, in this case, esv3641421, in the CEU population. (C) The filtering process of the duplications. (D) The breakdown of the number of duplications based on their exonic content and allele frequency. The legend below indicates the color-coded functional categories. We observed an enrichment of genic content among the very common (>5% allele frequency) duplications when compared with the genic content of all polymorphic bi-allelic duplications (P-value = 0.03684, one-tail Pearson's Chi-squared test with Yates' continuity correction).

