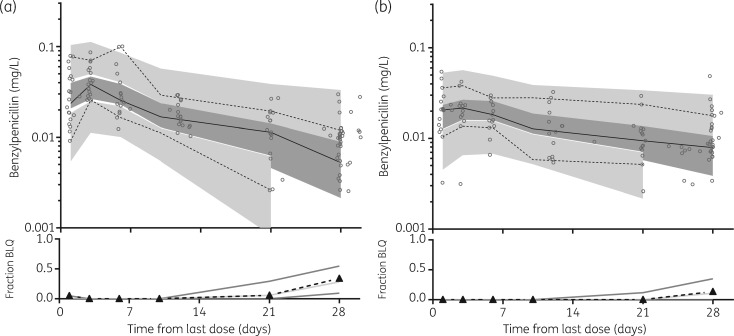
Figure 3.
Prediction-corrected VPCs for plasma benzylpenicillin concentrations (mg/L on log10 scale) for children with a lower BMI (<25 mg/kg2; a) and a higher BMI (≥25 mg/kg2; b). Observed 50th (continuous line) and 10th and 90th (dotted lines) percentiles within their simulated 95% CI (dark grey shading represents the 95% CI for the observed; light grey areas represent the 95% CI for the 10%–90% percentiles) are shown; data points are indicated by circles. Fraction BLQ (triangles with dashed black line) is also demonstrated with the simulated median (light grey line) and 95% CI (darker grey lines).

