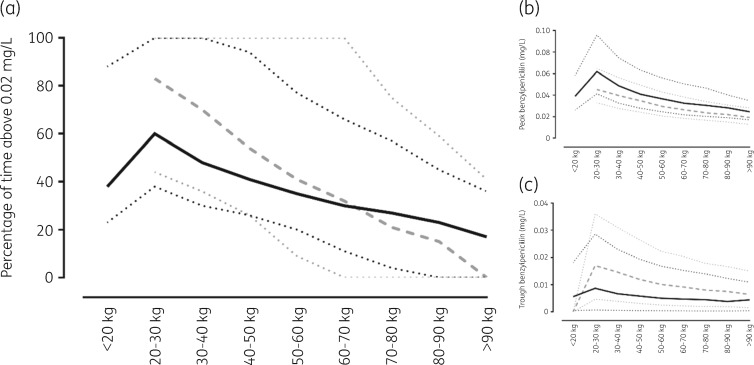
Figure 4.
Summary of simulations of 1000 children with a lower BMI [<25 mg/kg2; continuous black line (median) and dotted black lines (90% prediction intervals)] and a higher BMI [≥25 mg/kg2; dashed grey line (median) and dotted grey lines (90% prediction intervals)] with equal numbers of gender. (a) Percentage of time >0.02 mg/L. (b) Peak concentrations. (c) Trough concentrations.

