Figure 1.

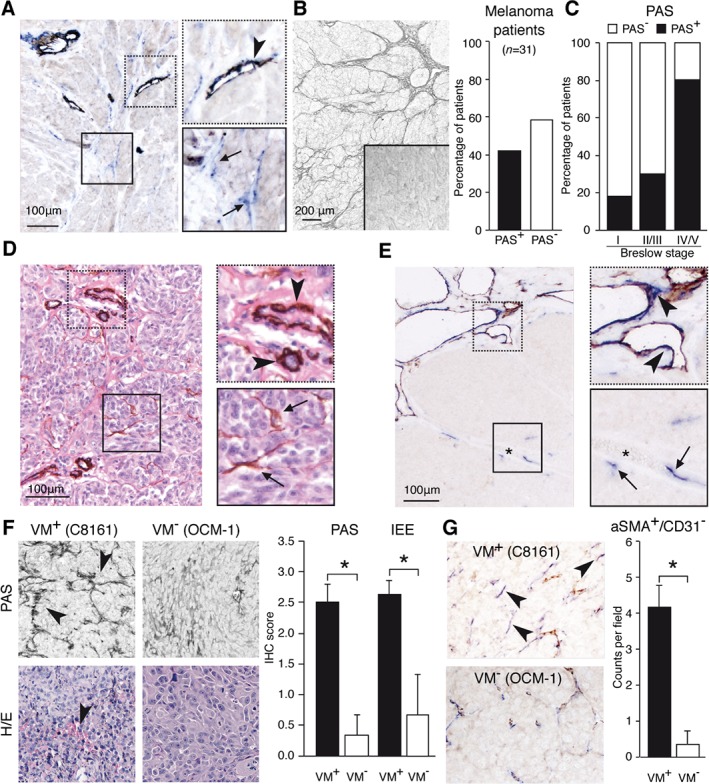
Vascular‐like structures in aggressive VM+ tumors contain perivascular cells that are not associated with regular blood vessels. (A) Double staining for the endothelial cell marker CD31 (brown) and the perivascular marker αSMA (blue) in human melanoma tissue. The upper right panel shows αSMA+ cells around a CD31+ blood vessel (arrowhead). The lower right panel shows the presence of αSMA+ cells not associated with CD31+ endothelial cells (arrows). (B) Representative picture of PAS staining of VM‐characteristic patterned vascular networks in human melanoma tissue. The bar graph shows the percentage of melanoma patients showing this PAS+ staining. (C) Percentage PAS+ and PAS− tumor tissues in melanoma patients classified according invasive activity, based on Breslow staging. (D) αSMA staining of a melanoma tissue section counterstained with hematoxylin and eosin. The upper right panel shows αSMA+ cells around blood vessels (arrowheads). The lower right panel shows the presence of αSMA+ cells associated with vasculogenic matrix networks (arrows). (E) Similar staining to that in A on Ewing sarcoma tissue. Asterisk indicates a VM‐characteristic blood lake. (F) PAS staining (upper panels) and hematoxylin and eosin staining (H/E; lower panels) of C8161 tumors (left panels) and OCM‐1 tumors (right panels). The bar graph shows quantification (± SEM) of the PAS loops and intratumoral extravascular erythrocytes (IEE) in OCM‐1 (n = 4) and C8161 (n = 5) tumors. *p < 0.05, Student's t‐test. (G) Double staining similar to that in A of OCM‐1 (n = 4) and C8161 (n = 5) tumors. Arrowheads indicate αSMA+ cells not associated with CD31+ endothelial cells. The bar graph shows the number of αSMA+ cells (± SEM) per microscopic field. *p < 0.05, Student's t‐test.
