Figure 1.

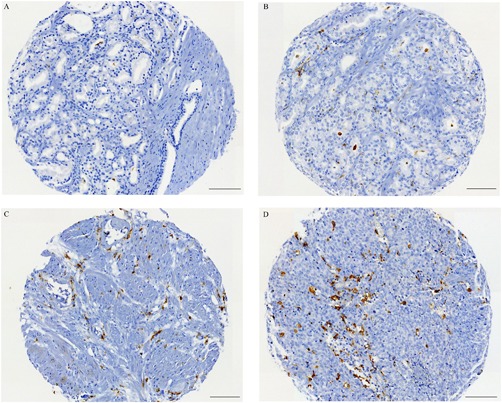
Representative immunohistochemical images of PCa tissue cores stained to visualize the M2 macrophage marker CD163 (brown). A‐B; low number of macrophages. C‐D; high number of macrophages. Scale bars 100 μm

Representative immunohistochemical images of PCa tissue cores stained to visualize the M2 macrophage marker CD163 (brown). A‐B; low number of macrophages. C‐D; high number of macrophages. Scale bars 100 μm