
Figure 1.
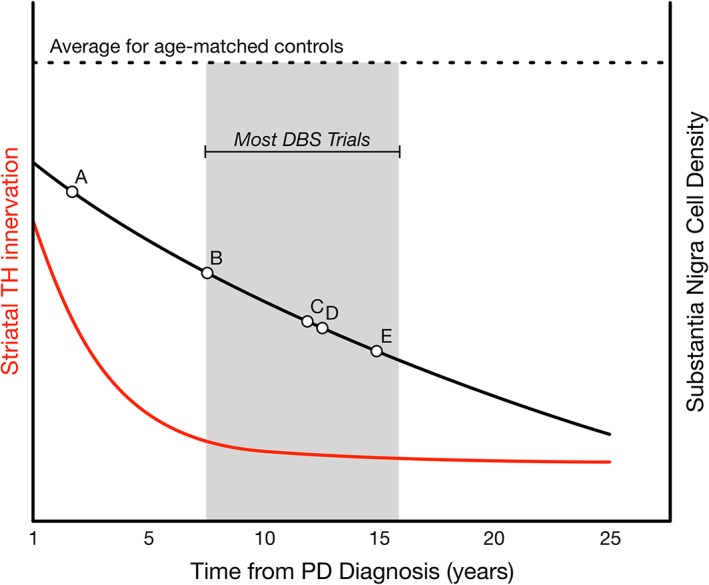
Timing of nigrostriatal degeneration (adapted from Kordower et al [2013]12. Average time course for degeneration since diagnosis of PD (x axis) is plotted for both putaminal TH immunoreactivity (left y axis, red line) and number of melanized neurons in the substantia nigra (right y axis, black line) compared with the average from age‐matched controls (dashed line). The gray box brackets the window during which the majority of trials examining STN DBS have occurred (compare with Table 1). For illustration, points A, B, C, D, and E correspond to the studies conducted by Charles et al,36 Schuepbach et al,4 Tagliati et al,21 Hilker et al,22 and Pal et al,34, 35 respectively.