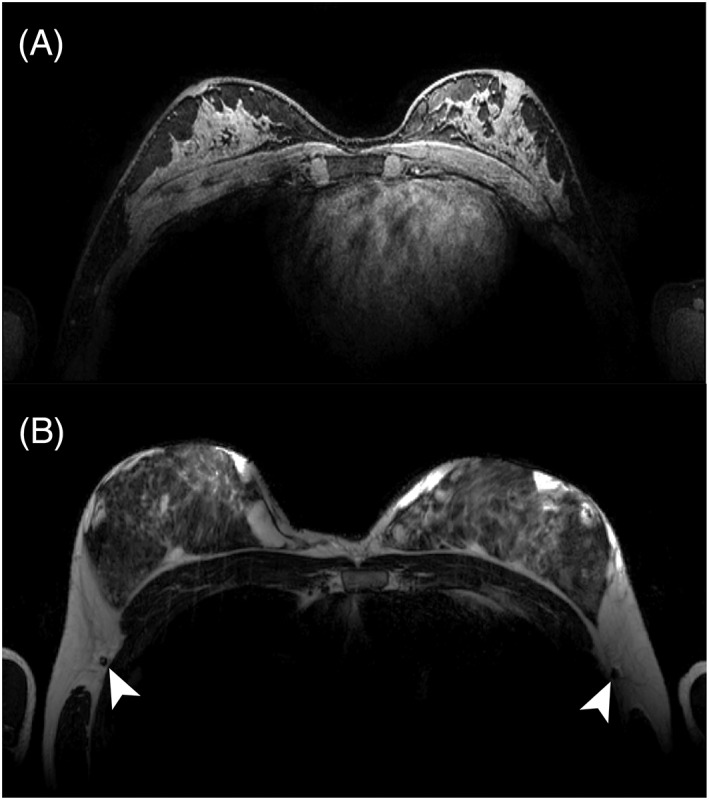
Figure 7.

Examples of clinical scans acquired with the coil. A, A transversal slice of a fat‐suppressed T 1‐weighted image (T R = 7.1 ms; T E = 3.2 ms; flip angle = 8°; resolution 0.7 mm3; SENSE 4 × 2 (RL × FH), 1–4–6‐4‐1 spectral spatial RF pulse for fat suppression). A total acceleration of R = 8 was used, compromising the SNR achieved in the axilla, yet high detail can be observed in the glandular tissue. B, A transverse T 2‐weighted TSE image (T R = 10 000 ms; T E = 90 ms; flip angle = 90°; resolution = 0.7 × 0.7 × 3 mm3; TSE factor = 17) . Note the lymph nodes in the axilla depicted as hypo‐intense spots indicated by the white arrows
