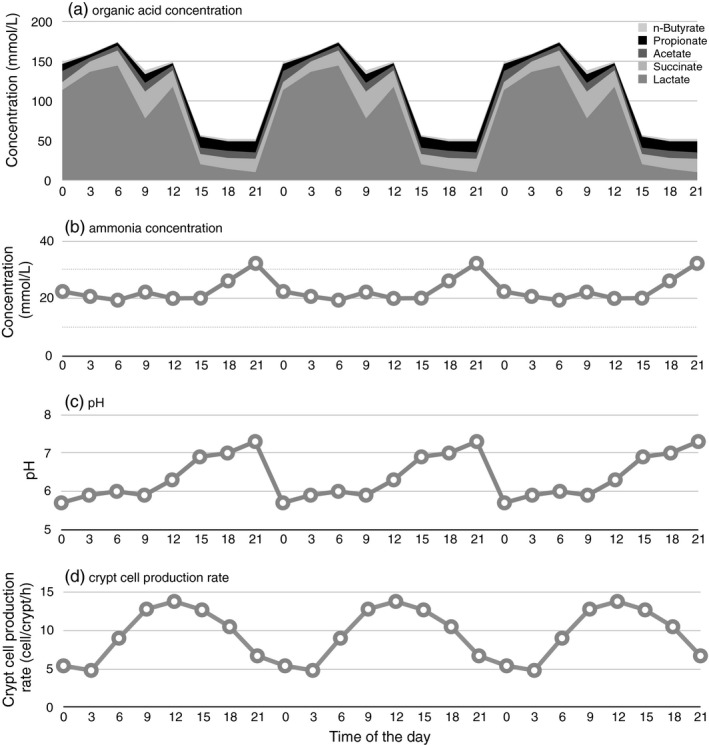
Figure 2.

Means of (a) organic acid concentration, (b) ammonia concentration, and (c) pH in the cecal supernatant, and (d) crypt cell production rate of cecal epithelium of rats fed AIN‐93 diet added with 7.5 g/100 g fructooligosaccharides between 20:15 and 23:15. All parameters except for n‐butyrate concentration showed statistically significant diurnal variance (p < 0.05). The same data were plotted three times to show the periodicity (Inagaki, 1999)
