
Figure 5.
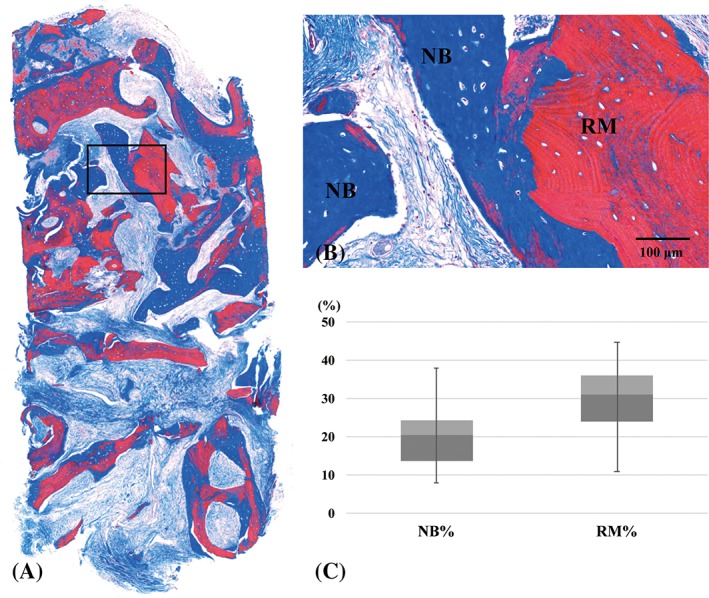
Representative histologic views and histomorphometric analysis in the test group. Images represent the entire specimen from the core biopsy procedure (A), a high magnification view of the boxed area in panel A (B), and a histomorphometric analysis of the core biopsy specimens (C). NB, newly formed bone; RM, residual bone substitute particle; NB%, percentage of newly formed bone; RM%, percentage of residual bone substitute material