Figure 3.

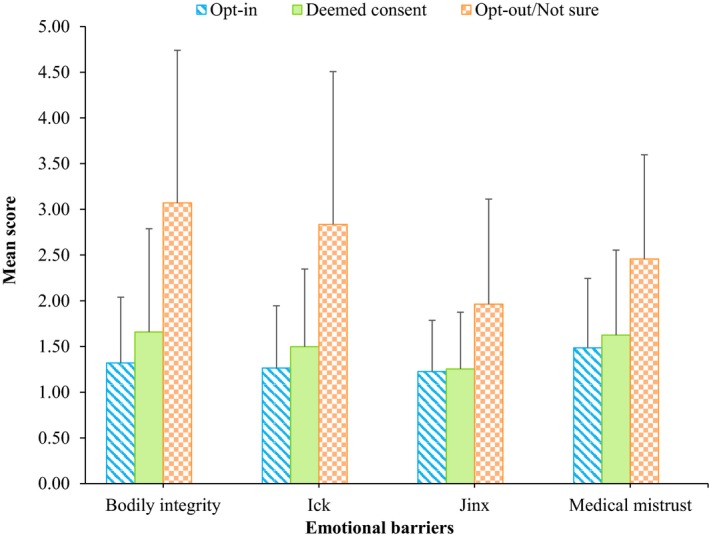
Bar graph showing mean emotional barriers scores of the three participant groups. Error bars are SDs. [Colour figure can be viewed at wileyonlinelibrary.com]

Bar graph showing mean emotional barriers scores of the three participant groups. Error bars are SDs. [Colour figure can be viewed at wileyonlinelibrary.com]