
Figure 2.
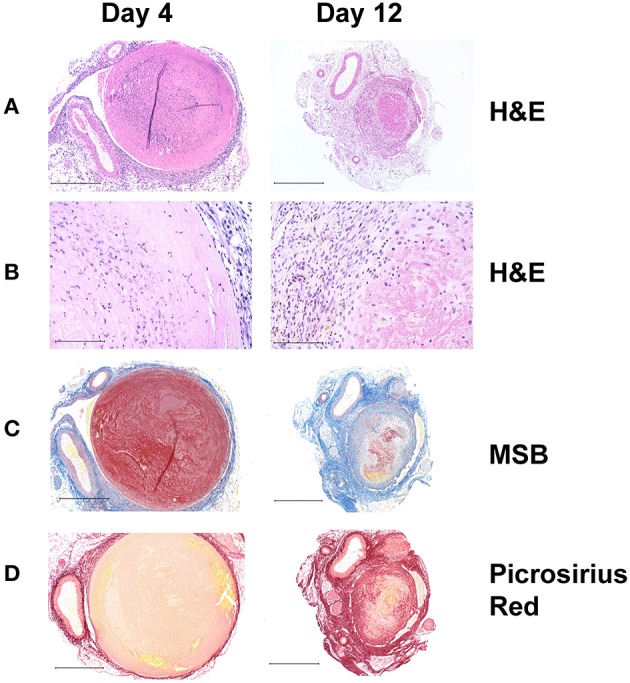
Histochemical analysis of thrombus sections from a stasis induced mouse model of DVT. In this model, thrombus formation occurs maximally at day 4 and resolves naturally thereafter with day 12 serving as a measure of thrombus resolution. (A) Hematoxylin and Eosin (HandE) stain showing overall tissue morphology; (Original magnification x100, Scale bar 500 μm) and (B) cell infiltrates. The nucleated cellular population at day 4 comprises mostly of neutrophils and few macrophages, whereas both macrophages and neutrophils can be seen at day 12 (Original magnification x400, Scale bar 100 μm). (C) Martius Scarlet Blue (MSB) stain showing fibrin content in red (Original magnification x100, Scale bar 500 μm). (D) Picrosirius Red stain showing collagen content in red (Original magnification x100, Scale bar 500 μm). As the thrombus resolves, it becomes smaller in size, fibrin content is decreased via fibrinolysis and there is an increase in intrathrombus collagen content.