
Figure 5.
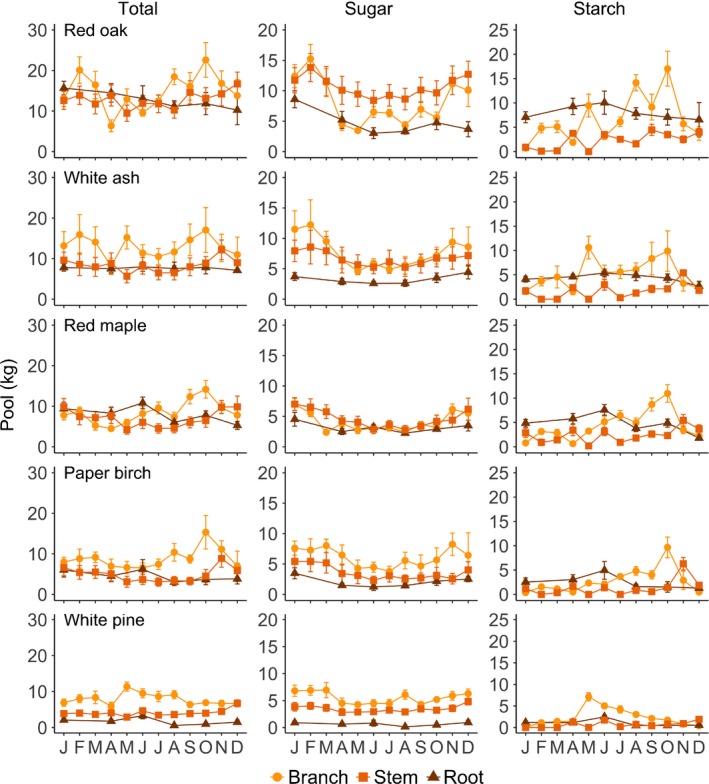
Seasonal dynamics of whole‐organ total nonstructural carbohydrate (NSC) (left), sugar (middle), and starch (right) pools for five temperate tree species (rows) sampled monthly at Harvard Forest in 2014. Error bars denote ± 1 SE of the mean. Note the difference in y‐axis scale between columns.