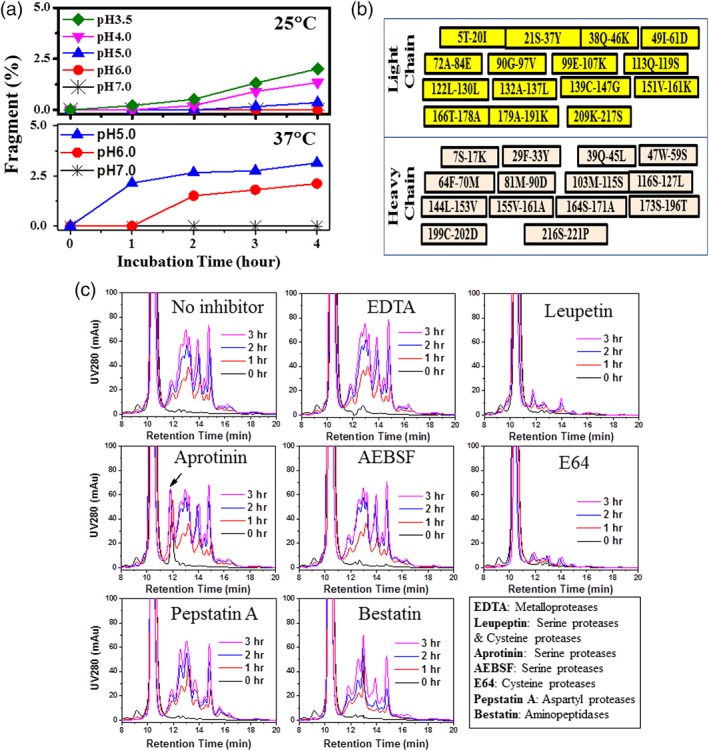
Figure 2.

Characterization of the protease optimal pH, cleavage sites, and the effect of inhibitors. (A) The effects of pH and temperature on the protease‐induced fragmentation determined by HP‐SEC (after pH 3.5 incubation). (B) Schematic summary for the Fab A fragments identified by mass spectrometry with the N‐ and C‐terminal amino acids labeled. (C) Effect of protease inhibitors on fragmentation as visualized by HP‐SEC profiles (after pH 3.5 incubation). The legend gives the protease family for which the inhibitor is intended; inhibitor concentration was controlled to 1 mM.
