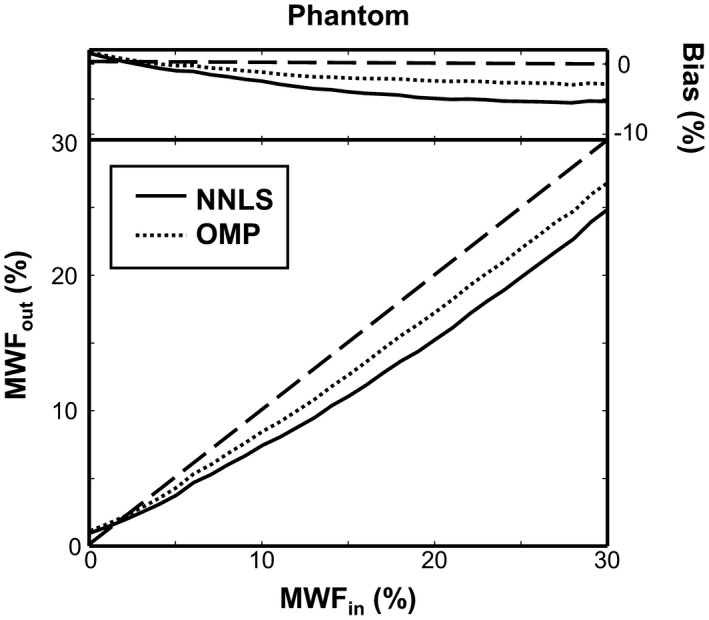
Figure 5.

The estimated MWF from the phantom model using the NNLS (solid line) and the OMP (dotted line) is plotted against the defined MWF. The dashed black line depicts the ground truth MWF, whereas the top of the figure shows the absolute bias of the estimated MWF
