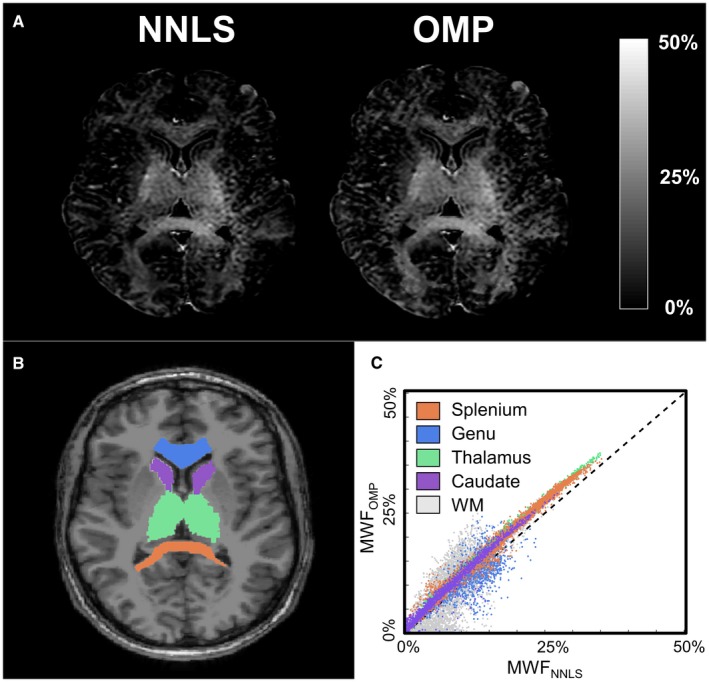
Figure 6.

The results of the MSE sequence of a single representative subject (male, 28 year). The MWF map estimated with the NNLS and OMP methods (A), the T1‐weighted image with the delineated ROIs (B), and a scatter plot of the MWF values in the ROIs and all WM (C) are shown ROI, region of interest; WM, white matter
