
Figure 1.
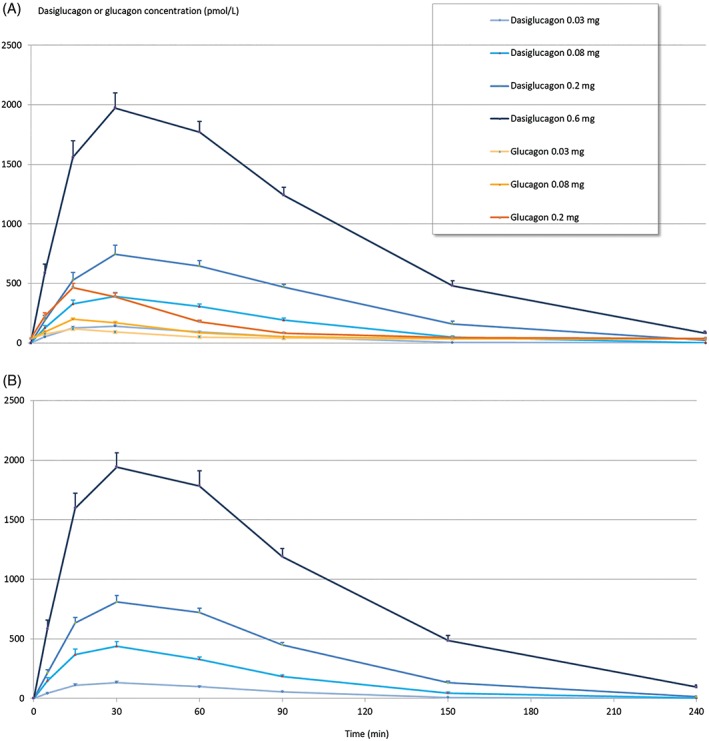
Pharmacokinetic profiles. Mean plasma concentration profiles and SEM at euglycaemia (A) and at hypoglycaemia (B) after single subcutaneous doses of dasiglucagon and commercial glucagon (Eli Lilly)
Official websites use .gov
A
.gov website belongs to an official
government organization in the United States.
Secure .gov websites use HTTPS
A lock (
) or https:// means you've safely
connected to the .gov website. Share sensitive
information only on official, secure websites.
Pharmacokinetic profiles. Mean plasma concentration profiles and SEM at euglycaemia (A) and at hypoglycaemia (B) after single subcutaneous doses of dasiglucagon and commercial glucagon (Eli Lilly)