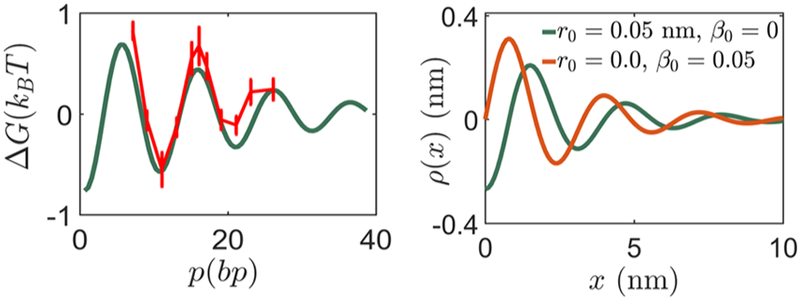
Figure 6.

The first figure shows the variation of interaction energy ΔG with distance p between the two proteins P1 and P2. The boundary conditions r1 = 0.001 nm, β1 = 0.0045 for P1 and r2 = 0.001 nm, β2 = −0.0045 for P2 give the best fit to the experimental data for ΔG.7 In the second figure, we show the variation of change in groove width when a protein with boundary conditions r0, β0 binds at x = 0. The decaying sinusoidal character is documented in previous work.7,22 The magnitude of the change in groove width (~3 A) is consistent with estimates in ref 12.
