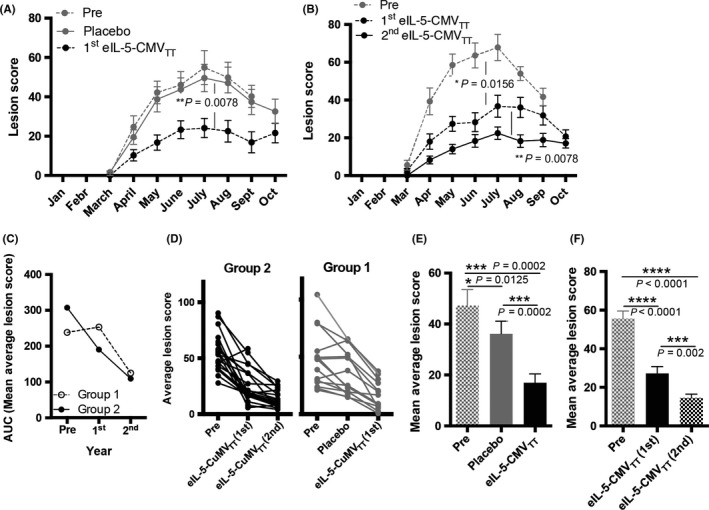
Figure 5.

Improving IBH lesion scores by vaccination with eIL‐5‐CuMVTT vaccine. A & B, Mean monthly lesion score from March until October in “Pre‐evaluation” year (n = 34), “1st year” (placebo‐controlled double‐blind randomized study, n = 34), and “2nd year” (half crossover follow‐up vaccination, n = 30). Months with more than one measurement show mean values. A, Group 1 horses in “Pre‐season” (dotted gray line, n = 15), blinded placebo treatment “1st year” (continuous gray line, n = 15), and first season with vaccine treatment “2nd year” (dotted black line, n = 13). B, Group 2 horses in “Pre‐season” (dotted gray line, n = 19), blinded vaccine treatment “1st year” (dotted black line, n = 19), and follow‐up second year vaccine treatment (continuous black line, n = 17). C, Area under the curve of mean average lesion score per year of Group 1 (empty circles) and Group 2 (filled circles). D, Average (of monthly mean) lesion score per year of single horses in Group 2 (black lines) and Group 1 (gray lines) during “Pre‐season” (pre), placebo treatment or eIL‐5‐CuMVTT vaccination “1st year,” and eIL‐5‐CuMVTT vaccination “2nd year”. E, Mean average lesion score of all Group 1 horses during “Pre‐season” year (pre, gray pattern, n = 15), blinded placebo treatment “1st year” (filled gray, n = 15), and eIL‐5‐CuMVTT vaccination “2nd year” (filled black, n = 13). F, Mean average lesion score of all Group 2 horses during “Pre‐season” (pre, gray pattern, n = 19), blinded first year eIL‐5‐CuMVTT vaccination “1st year” (filled black, n = 19), and follow‐up eIL‐5‐CuMVTT vaccination “2nd year” (black pattern, n = 17). All graphs include all horses, n = 34 (“Pre‐season”, “1st year”), n = 30 (“2nd year”), independent of antibody titer: ITT, intention to treat; IBH, insect‐bite hypersensitivity
