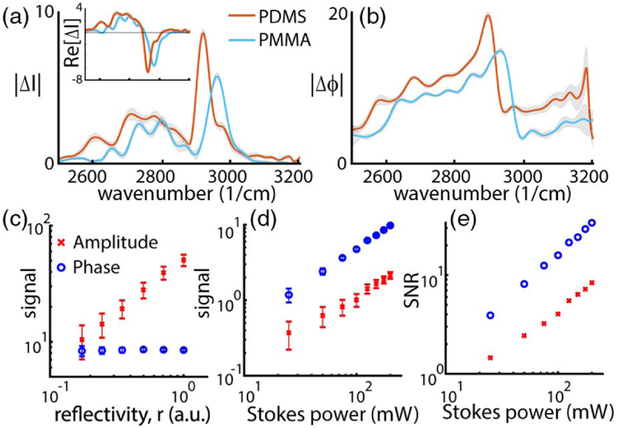
Fig. 3.
(a) Amplitude and (b) phase spectra from PDMS and PMMA. Amplitude spectra show the expected peaks at 2900 and 2950 cm−1, respectively. Inset shows changes in-phase with the Stokes modulation. (b) Dispersive spectra show their characteristic shape with a 50 cm−1 shift between PMMA and PDMS. Signal scaling with (c) reflectivity and (d) the Stokes power. (e) Signal-to-noise scaling with the Stokes power.

