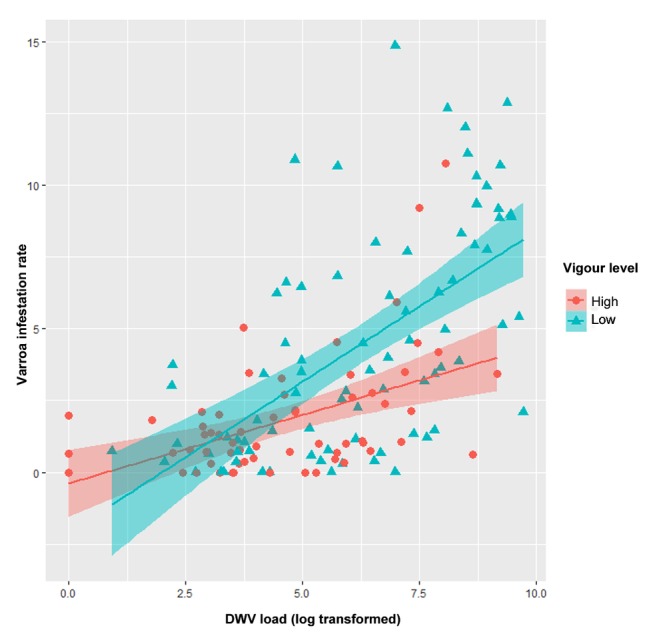
Figure 2.

Scatter plot showing correlation of DWV load and varroa infestation rate. Low-vigor colonies are shown in blue; high-vigor colonies, red. Regression lines and confident bands are also shown.

Scatter plot showing correlation of DWV load and varroa infestation rate. Low-vigor colonies are shown in blue; high-vigor colonies, red. Regression lines and confident bands are also shown.