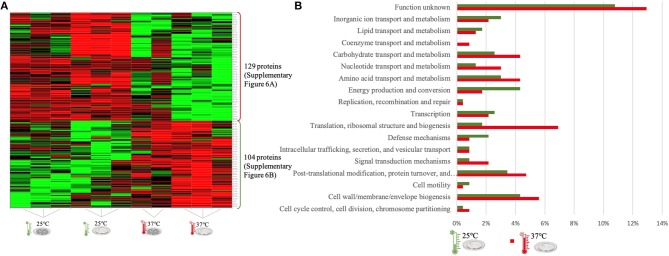
Figure 5.
LC-Progenesis ANOVA comparing the biofilm at 25 and at 37°C (Supplementary Table 4). The two biofilm stages are represented either by dark SS (stainless still) disks for early stage or cell filled gray SS disks for mature biofilm. (A) Heat map illustrating the abundance of each of the 233 statistical significantly different proteins obtained in this comparison. (B) Horizontal bar chart showing the percentage of proteins with higher abundance in each temperature setting by their predicted COG molecular function.

