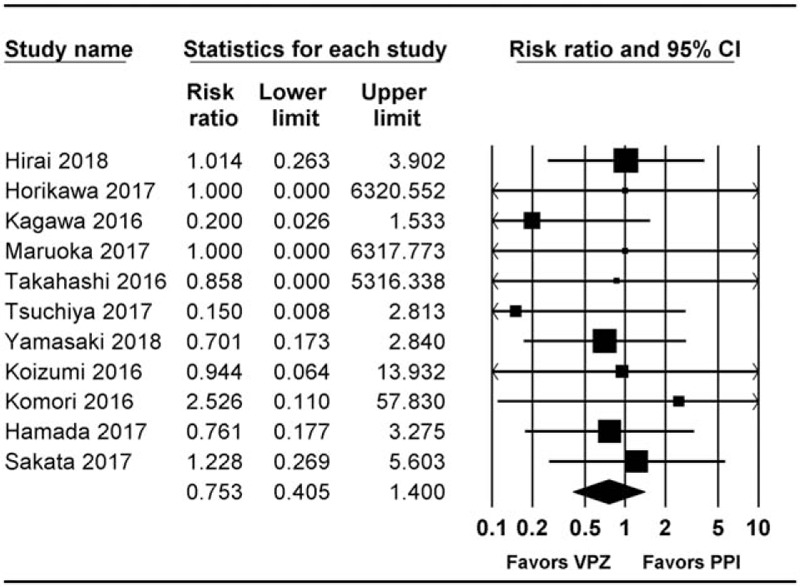
Figure 4.

Forest plot of studies comparing rate of delayed bleeding between vonoprazan-treated and PPI-treated groups. The figure depicts individual trials as filled squares with relative sample size and the 95% CI of the difference as a solid line. The diamond shape indicates the pooled estimate and uncertainty for the combined effect. CI = confidence intervals, PPI = proton pump inhibitor.
