Figure 3.

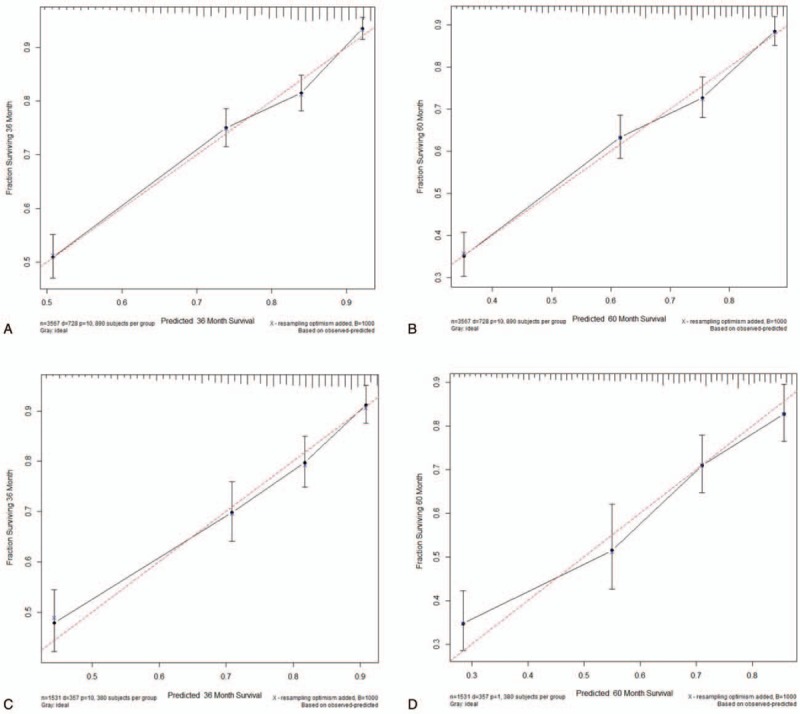
Calibration plots. Show the relationship between the predicted probabilities base on the nomogram and actual values of the train set (A and B) and validation set (C and D).

Calibration plots. Show the relationship between the predicted probabilities base on the nomogram and actual values of the train set (A and B) and validation set (C and D).