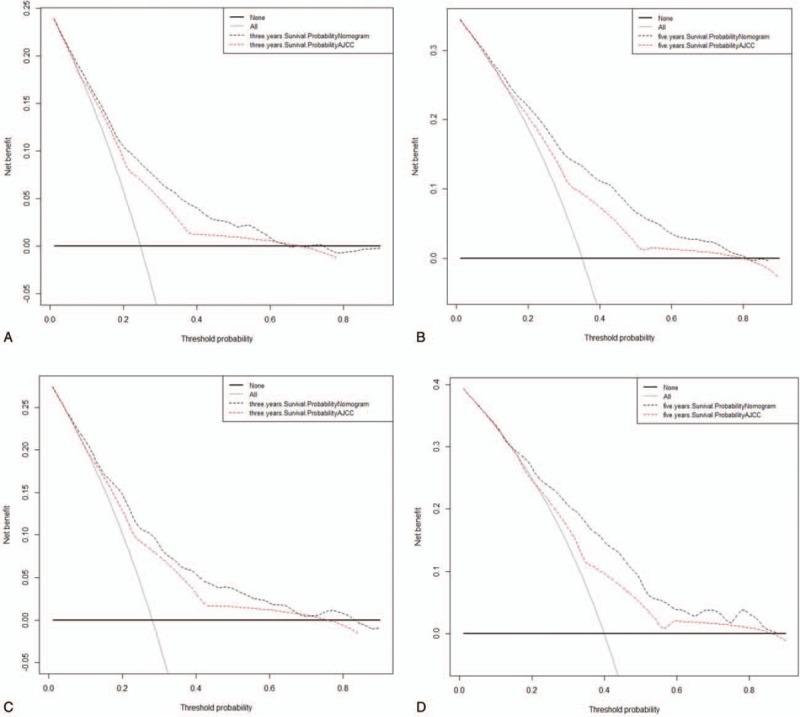
Figure 4.

Decision curve analysis. In the figure, the abscissa is the threshold probability, the ordinate is the net benefit rate. The horizontal one indicates that all samples are negative and all are not treated, with a net benefit of 0. The oblique one indicates that all samples are positive. The net benefit is a backslash with a negative slope. A and B came from the training set, and C and D came from the validation set.
