FIGURE 4.
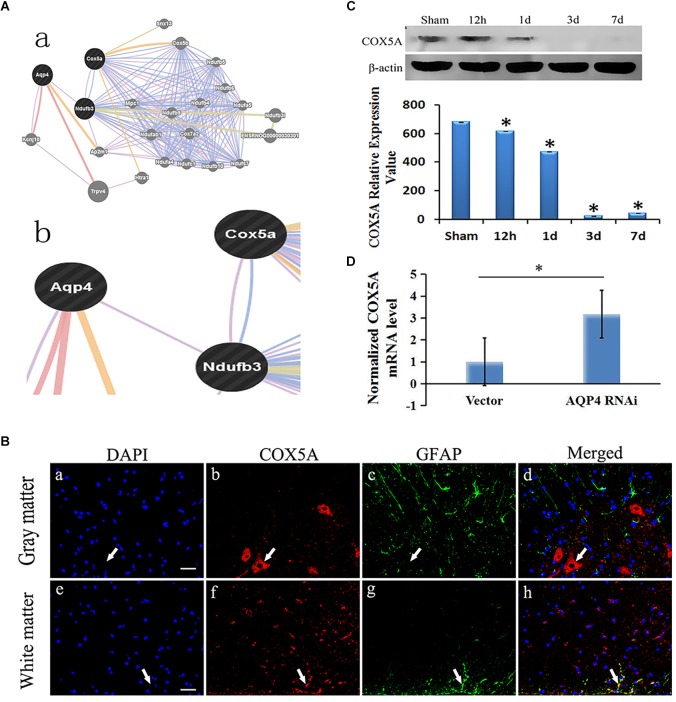
Correlation of AQP4 and COX5A in cytotoxic edema with SCC. (A) (A-a), Detailed analysis shows the results of bioinformatical analysis. (A-b): part of the bioinformatical analysis showed that AQP4 was co-expressed and co-localized with NADH dehydrogenase (ubiquinone) 1 beta subcomplex 3 (Ndufb3), COX5A and Ndufb3. (B) Immunofluorescence analysis demonstrated that COX5A (red) emerged in the anterior horn of spinal cord at 3 days after SCC. (B-a–d): co-expression of GFAP and COX5A in the gray matter of the spinal cord. (B-e–h): co-localization of GFAP and COX5A in white matter of spinal cord. (B-a): the nuclei were labeled by DAPI (blue). (B-b): COX5A immunoreaction (red). (B-c), GFAP immunoreaction (green). (B-d): merged (yellow) shows co-expression of DAPI and COX5A. (B-e): the nuclei are in white matter by DAPI (blue). (B-f), COX5A immune reactions (red). (B-g), GFAP-positive neurons, green. (B-h), Co-localization of COX5A and GFAP (yellow). Bar = 40 μm. (C) Western blotting shows the immunostaining of COX5A and beta-actin at sham, 12 h, 1 day, 3 days and 7 days. The density of bands was measured by ImageJ. Data were normalized to beta-actin. The expression of COX5A protein was significantly decreased compared to the sham group at 12 h, 1 day, 3 days, and 7 days after SCC. ∗P < 0.05 when compared to sham group (n = 8). (D) Following AQP4 lentivirus transduction in vivo, the expression of COX5A was detected by qRT-PCR. The level of COX5A was significantly increased in the AQP4-RNAi-LV group compared to the vector group. ∗P < 0.05 when compared to vector group (n = 8).

