
Figure 1.
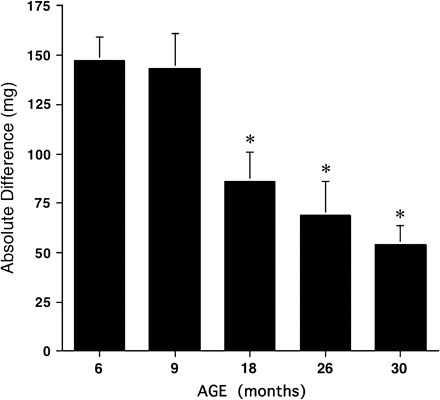
The absolute difference in mass (expressed in milligrams) between the plantaris of the control and functional overload groups was calculated and plotted for each age group. Bars are mean ± standard error. Asterisk denotes a significant difference (p < .001) from the 9-mo age group.