
Figure 3.
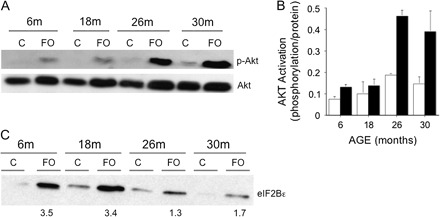
Akt and eIF2Bϵ expressions in male 6-, 18-, 26-, and 30-mo old Fisher 344–Brown Norway F1 hybrid rats following 14 days of functional overload (FO). (A) Western blots of phosphorylated (Ser-473) and native Akt in the plantaris (PL) of control (C) or 14-day FO rats. Each lane represents 200 μg of total protein extracted from a pool of three PL muscles. (B) Histogram of Akt activation, calculated as level of phosphorylation per amount of protein, in control (white) and FO (black) PL muscles of rats at different ages. Bars represent mean ± standard error of six rats. (C) Western blots of eIF2ϵ in the PL of control (C) or 14-day FO rats. Each lane represents 200 μg of total protein extracted from a pool of three PL muscles. The numbers below the FO lanes represent the mean fold increase in protein expression relative to control.