
Figure 5.
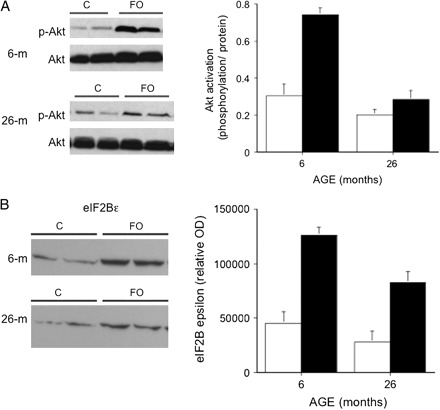
Akt and eIF2Bϵ expressions in male 6- and 26-mo old Fisher 344–Brown Norway F1 hybrid rats following 7 days of functional overload (FO). (A) Western blots of phosphorylated (Ser-473) and native Akt in the plantaris (PL) of control (C) or 7-day FO rats aged 6 and 26 mos. Each lane represents 200 μg of total protein extracted from a single PL muscle. Histogram of Akt activation, calculated as level of phosphorylation per amount of protein, in control (white) and FO (black) PL muscles of rats aged 6 and 26 mos. Bars represent mean ± standard error of six rats. (B) Western blot of eIF2ϵ in the PL of control (C) or 7-day FO rats aged 6 and 26 mos. Each lane represents 200 μg of total protein extracted from a single PL muscle. Histogram of eIF2ϵ protein expression, calculated as a relative optical density, in control (white) and FO (black) PL muscles of rats aged 6 and 26 mos. Bars represent mean ± standard error of six rats.