
Figure 1. How weather-based forecasting facilitates an early public health response to a mosquito-borne disease outbreak.
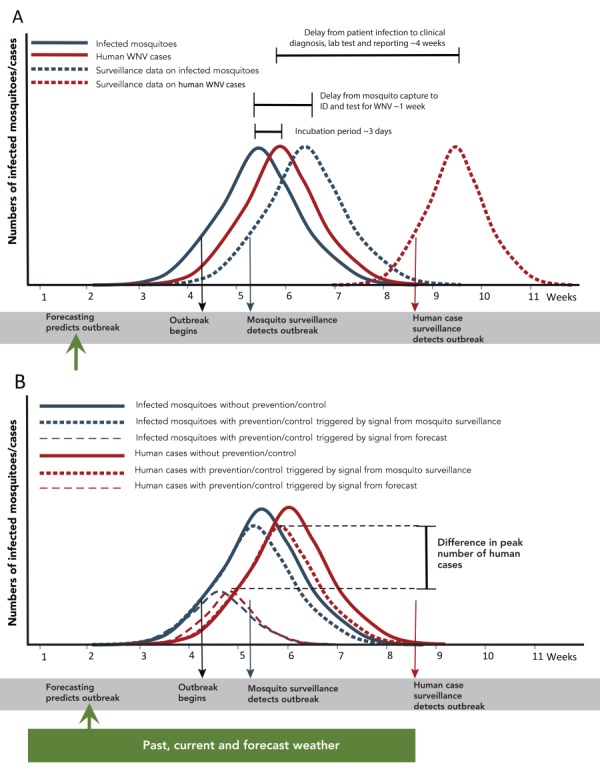
Abbreviations: ID, identify; WNV, West Nile virus
Figure legend: In panel A, the numbers of infected mosquitoes and human infections at the time they occur is shown by solid lines graph, and the numbers of infected mosquitoes and human infections at the time they are detected by surveillance systems is shown by dashed line graphs. The reasons for, and duration of, delays between occurrence and detection by surveillance are shown by horizontal lines. In panel B, the numbers of infected mosquitoes and human infections in the absence of public health intervention (shown by the solid line graphs), are compared against the numbers if interventions are started in response to signals from mosquito surveillance (shown by dotted lines) or by forecasting (shown by dashed line graphs). The black arrow indicates the start of an outbreak; the green, blue and red arrows indicate the signals of an outbreak provided by forecasting, and mosquito and human case surveillance respectively. The green rectangle indicates the past current and forecast weather used to develop the mosquito forecast