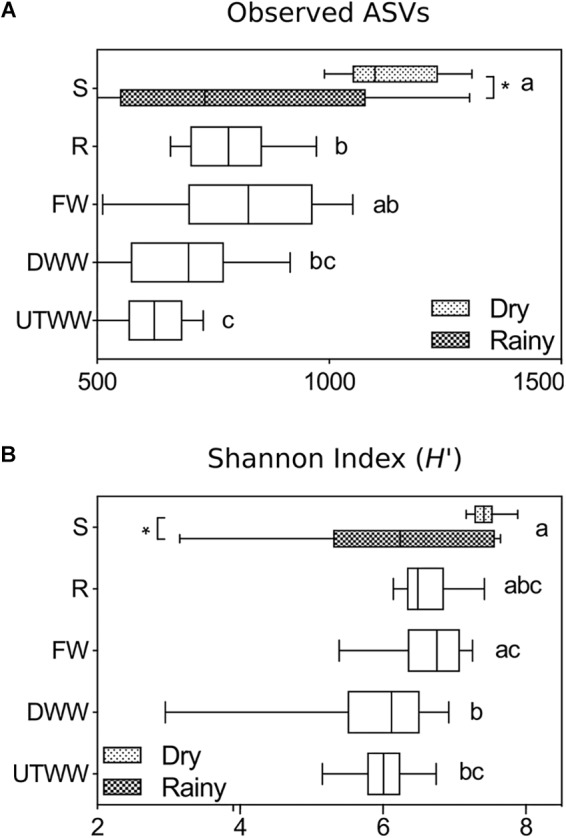
FIGURE 1.

(A) Richness and (B) diversity indices of the total fungal communities in Shrubland (S), Rainfed (R), Freshwater (FW), Dam wastewater (DWW), and Untreated wastewater (UTWW) irrigation systems, during the dry and rainy season. Box are extended from the 25th to 75th percentiles, the line in the box is plotted at the median. Whiskers represent the smallest and the largest value. A mix effect model followed by Bonferronis multiple comparison tests were used to determine differences among land use systems, and between seasons. Different letters indicate statistical difference among land use systems and ∗ indicate statistical differences between seasons (p ≤ 0.05). Only parameters differing significantly between seasons in each land use system are shown, if they did not differ, samples of both seasons were merged.
