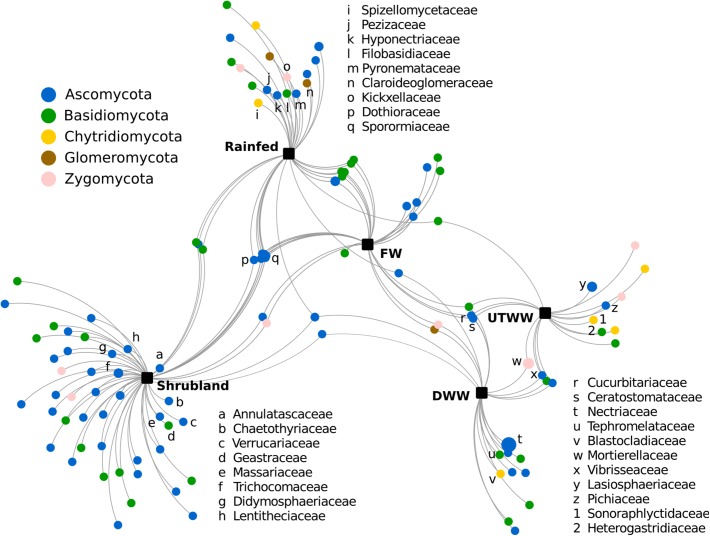
FIGURE 5.
Correlation-based association network at family level of the fungal communities among land use systems: shrubland, rainfed, freshwater, irrigated with dam and untreated wastewater, respectively. Only statistical significant fungal families are visualized (p ≤ 0.05). The size of the nodes is proportional to the taxon relative abundance and the edge width corresponds to the association strength of each taxon with the land use system.

