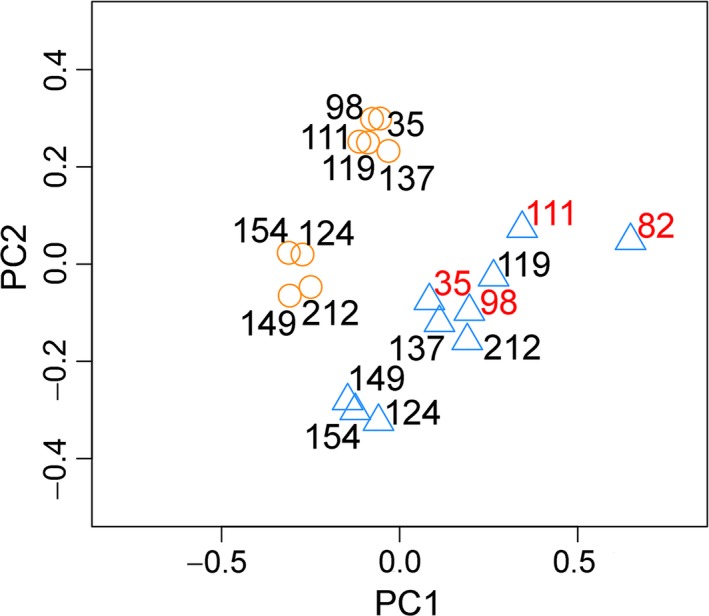
Figure 1.

Gene expression profiles in tumor and tumor‐free tongue samples from ten patients with SCCOT. Principal component analysis (PCA) revealed distinct gene expression profiles in tumors (blue triangle) compared to tumor‐free controls (orange circle). Overall, gene expression profiles in tumors from young patients (patient ID in red) were similar to those from older patients
