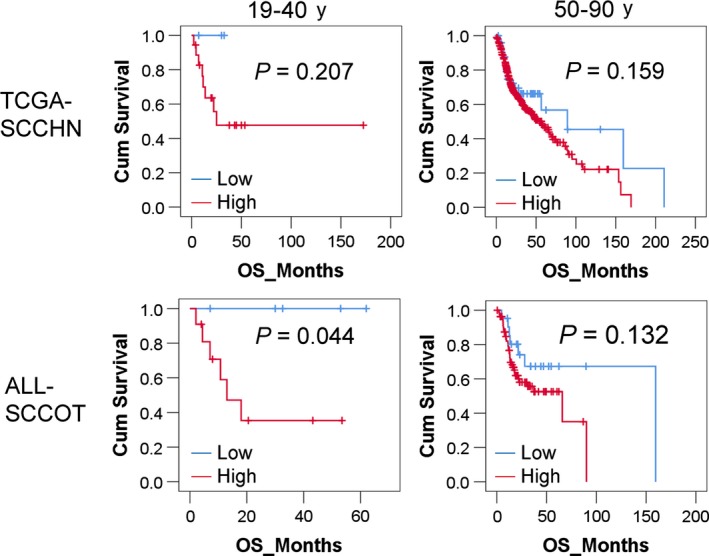
Figure 3.

Overall survival analysis by Kaplan‐Meier method. Patients were divided into groups according to age. Overall survival analysis was performed using Kaplan‐Meier method. Log‐rank P values are shown in the plots. The red line represents patients with high‐CNV burden and the blue line patients with low‐CNV burden. According to TCGA data (TCGA‐SCCHN), there was no significant correlation between overall survival and CNV burden for the whole group of patients with SCCHN. The number of young patients (19‐40 y) with low or high CNV being 3 and 18, respectively. Combining TCGA on SCCOT with our data (ALL‐SCCOT), the overall survival rate in young patients with low‐CNV (n = 5) was significantly higher than that in young patients with high‐CNV (n = 11) (log‐rank test P = 0.044)
