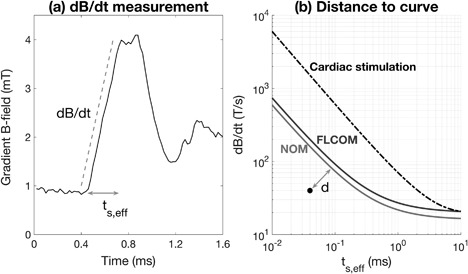
Figure 2.

(a) shows how the time derivative of the gradient field, dB/dt, and the corresponding effective stimulus duration, t s,eff, were measured for each B‐signal peak. (b) shows the limits, in terms of dB/dt and t s,eff, applied to normal operating mode (bottom curve) and first‐level controlled operating mode (middle curve), and the limit for cardiac stimulation (top curve). The dot in the graph represents the rising or falling edge of one signal peak, and d is the minimum geometric distance from the dot to the normal operating mode‐curve.
