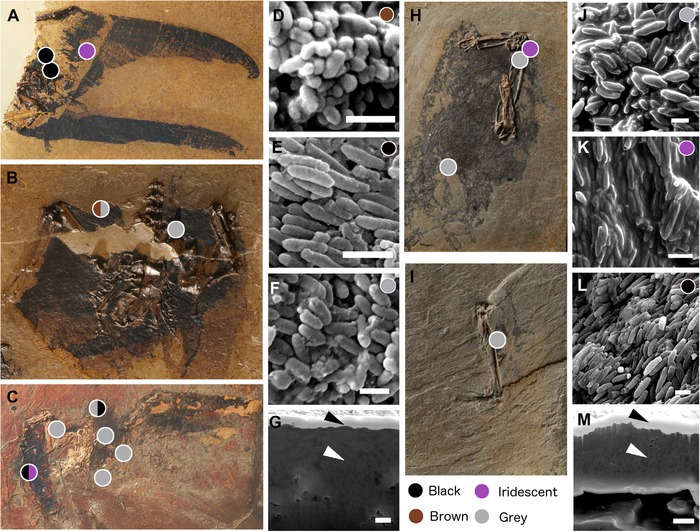
Figure 5.

Fossil specimens and examples of fossil melanosome samples for each predicted color. Sample sites are marked by colored dots, where color indicates predicted color (details of prediction posterior probabilities can be found in Supporting Information Data). (A) Scaniacypselus szarskii (SMF‐ME 11345A), (B) S. szarskii (SMF‐ME 11345B), (C) S. szarskii (SMF‐ME 599), (D) morphology of fossil melanosomes in S. szarskii predicted as brown plumage, (E) morphology of fossil melanosomes in S. szarskii predicted as black plumage, (F) morphology of fossil melanosomes in S. szarskii predicted as grey plumage, (G) cross section of fossil sample from S. szarskii (SMF‐ME 599) predicted as black plumage (sample surface and cross‐sectioned area indicated with black and white arrows respectively), (H) cf. Primotrogon sp. (SMF Av 498a), (I) cf. Primotrogon sp. (SMF Av 498b), (J) morphology of fossil melanosomes in cf. Primotrogon sp. predicted as grey plumage, (K) morphology of fossil melanosomes in cf. Primotrogon sp. predicted as iridescent plumage, (L) morphology of fossil melanosomes in cf. Primotrogon sp. predicted as black plumage, (M) cross section of fossil sample from cf. Primotrogon (SMF Av 498a), predicted as iridescent plumage (sample surface and cross‐sectioned area indicated with black and white arrows respectively). Scale bars in (D–G) and (J–M) equal 1 μm.
