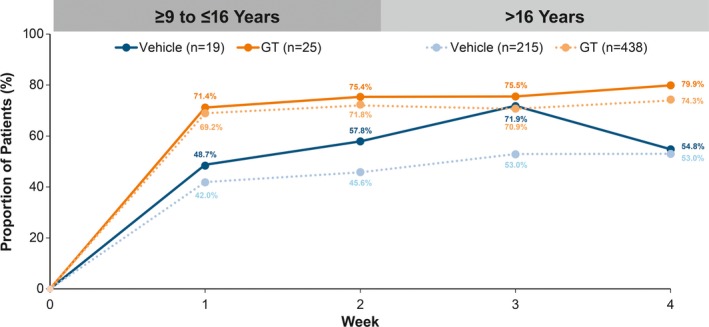
Proportion of patients with ≥ 50% reduction in sweat production
a to Week 4.
Intent‐to‐treat population.
P‐values not calculated as these comparisons were post hoc and not designed or powered to detect differences.Multiple imputation (MCMC) was used to impute missing values for Weeks 1‐4. GT, topical glycopyrronium tosylate; MCMC, Markov chain Monte Carlo

