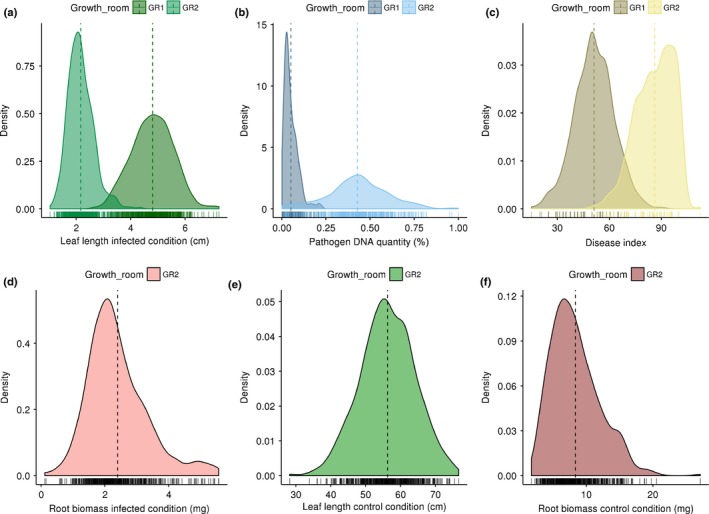
Figure 2.

Distribution of phenotypic data measured in the two growth rooms used for pathological tests. For each trait studied, data are coloured to show in which growth chamber the Arabidopsis plants were grown. Vertical coloured dashed lines indicate means of traits in each growth room. Data distribution is shown for leaf length (a), pathogen DNA quantity (b), disease index (c) and root biomass (d) in infected condition, and for leaf length (e) and root biomass (f) in noninfected condition. GR1 corresponds to growth room‐1. GR2 corresponds to growth room‐2.
